


🍯The Great Melt-Up🍯

Bitcoin Operator is free for everyone. I send updates like these twice a week, if you would like join our community and get updates like this delivered straight to your inbox subscribe below.
To Operators,
Up until early April the stock market (specifically US equities) was making sense. A global pandemic and oil war created uncertainly which drove a massive selloff as investors headed towards safer waters. However in the back half of 2020 things have gotten out of hand. What started as a rally off of a massive drop quickly morphed into a beast that makes little sense.
Record shattering unemployment? Stocks go up. Rising COVID-19 death and case counts? Stocks go up. Multiple industries facing unprecedented levels of economic pressure? Stocks go up. Earnings slashed 60%? You get it. The list goes on and on.
Thanks to Fed’s pledge to essentially provide QE Infinity, asset prices have effectively decoupled from not only fundamentals but also broader macro outlooks. The dangers here are extreme and essentially breaks the future down into two possibilities:
Using trillions of dollars the Fed is able to backstop this event and the economy is back on track by Q1-Q2 2021. Stocks rip to new highs like we’ve never seen before. Somehow we manage to dodge inflation and a virus resurgence.
The Fed utilizes QE infinity sending it’s balance sheet soaring to $10T+ but its not enough. Economic activity slows, unemployment spikes, GDP recedes, and the high of cheap debt US companies have been experiencing for the last decade wears off. Earnings multiples begin to recede to fairer levels and stocks crumble.
So which way do you bet? Well, let’s look at the data:
Liquidity
I’m a big believer that liquidity drives markets. The biggest price swings will be seen in markets where spreads between bids and asks widen and transactions slow. Another way of saying this is that when people are uncertain about a certain price level the price level will rise or fall until that certainty is regained.
Liquidity is hard to measure but one of my favorite proxies is the Nation Financial Conditions Index (NFCI) created by the Chicago Fed. You can see the NFCI from 1971 to today below:

For anyone interested in the math I suggest following the link above, but broadly, the index is a combination of three sub-indexes that track risk, credit, and leverage in the US markets. You can see clearly on this chart that financial conditions (think liquidity) during the 70s energy crisis, the 80s recession, and 2008 global financial crisis trended towards tighter. During these times we also saw markets recede. Notably missing is a significant spike today. At the end of march, coinciding with the global market dump, we saw a brief trend away from looser towards tighter as investors began to have second thoughts on risk, credit, and leverage. However this was quickly reversed by mid-June.
But what’s changed? Nothing. Things have actually gotten worse, COVID is rising and needed stimulus is being withheld.
Given the severity of the situation we’re in currently its not unreasonable to think the NFCI could trend towards levels seen in the past, coinciding with a decline in asset prices. Note this is a trailing index as it is updated weekly.
Unemployment
During recessions and depressions unemployment increases as revenue slides downward and companies reduce headcount to cut costs. Some companies are crushed even before they have a chance to take these measures. During the global shutdown in response to COVID-19 revenue has evaporated. Companies once who enjoyed healthy revenue streams are now doing startup-style burn rate calculations to determine how long they have to live.
We have already seen the impacts of this:
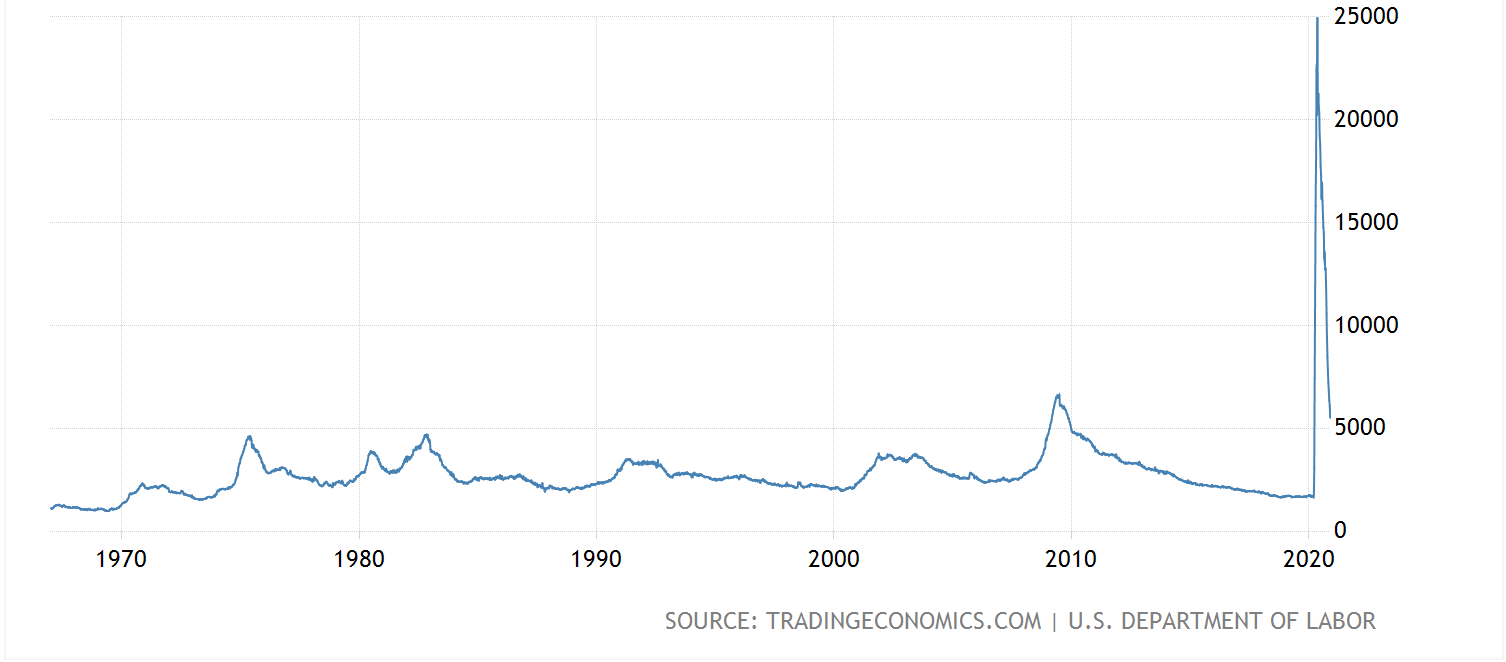
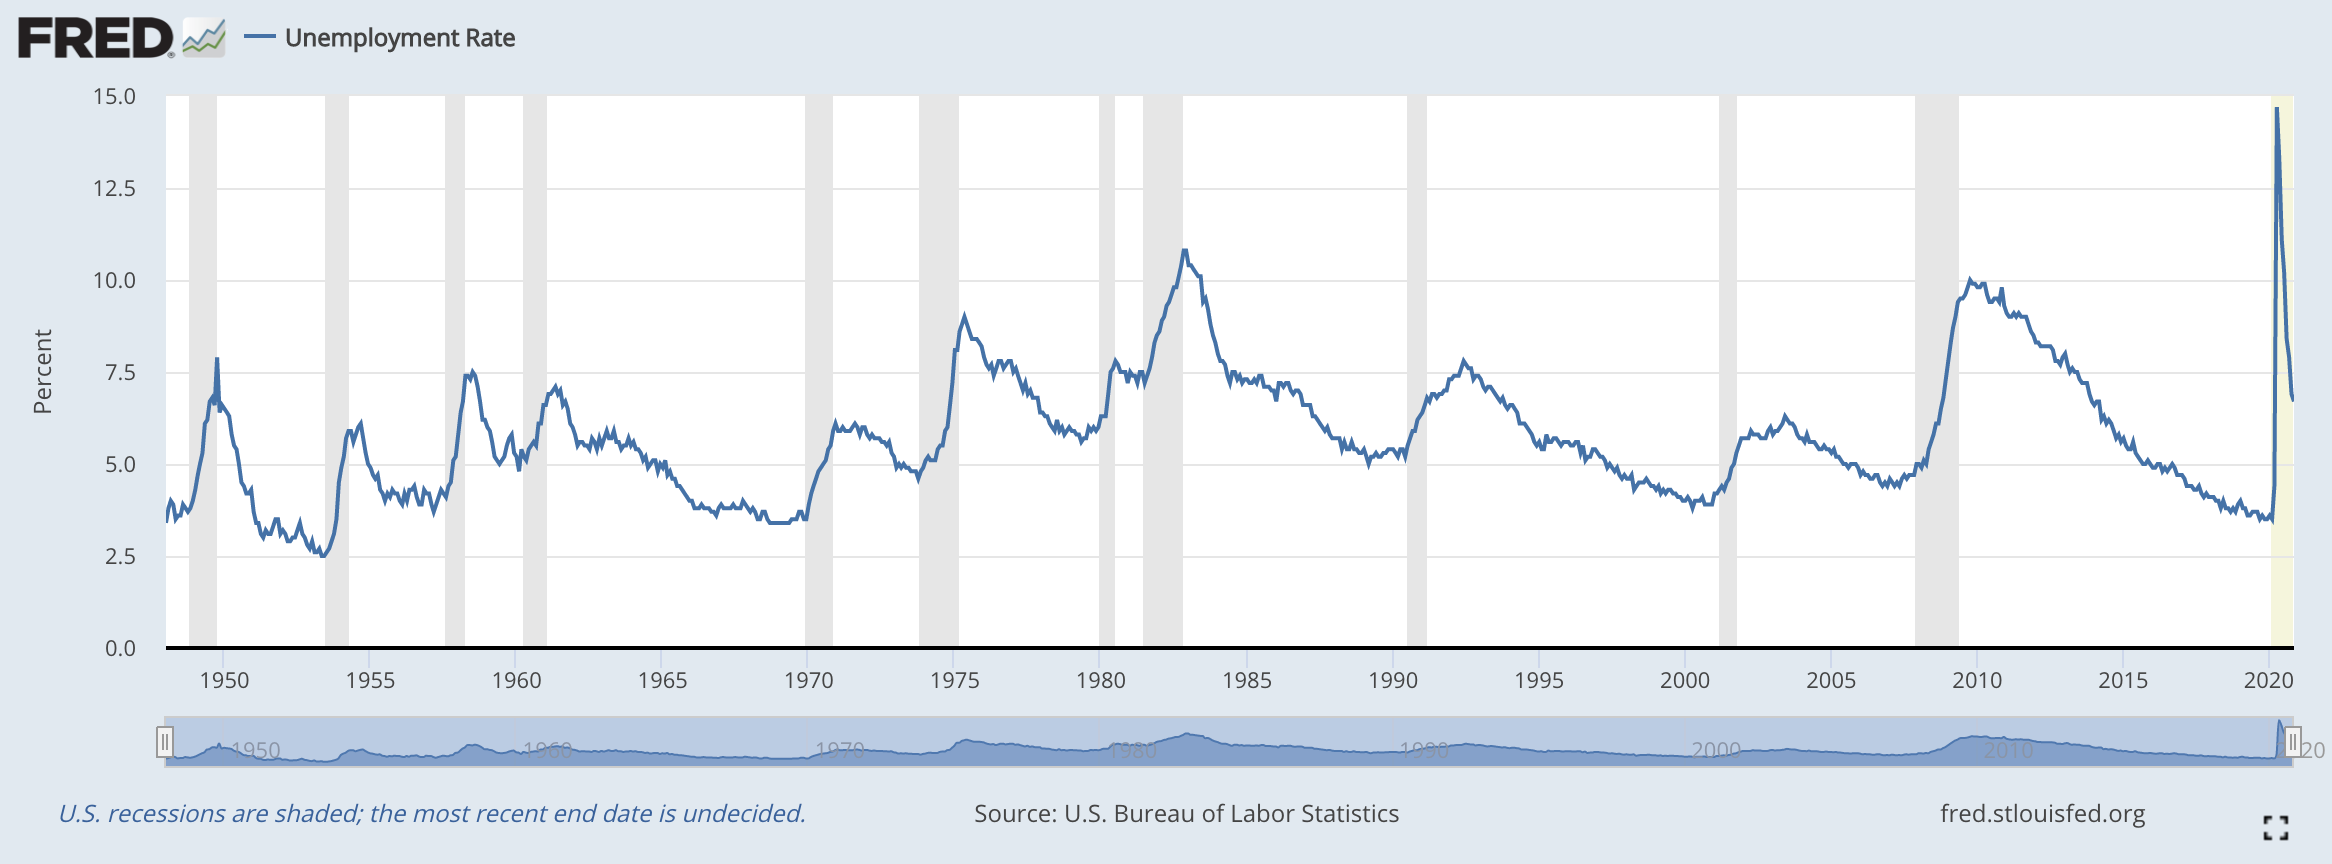
Note that while we have seen a sharp recovery, unemployment and jobless claims are still at levels seen in previous recessions. Some suggest the current unemployment rate is closer to 25%. The biggest takeaway here is that we’re at the beginning stages of finding out what the economic impact of this virus is, and all signs are pointing to it being like nothing we’ve ever seen before.
How did we get here?
The gains of the last decade have largely been powered by buybacks and dividends. Companies have capitalized on low interest rates and loose credit/risk tolerances to finance these stock buybacks with cheap debt. They then use the reduced float to boost earnings per share and this in turn boosts the stock price.

Additionally, over the same period dividends have been on the rise. These dividends have attracted yield seeking investors who were previously confined to the bond markets. The added demand has helped with upward pressure on asset prices.

A recession is the perfect storm to kill off these two trends. With revenues already falling, companies have suspended or terminated their stock buyback programs. Companies asking for government bailouts may even be mandated to do so. As companies protect cash to survive, dividends will be the next cut to make. Adding to this, it’s reasonable to assume those same yield seeking investors likely won’t hold on as the risk ratchets upward.
The Game Plan
Thinking back to the earlier scenarios, I’m betting that door number two is most likely given the current market outlook. The macro forces against the market are too great and the fundamentals are getting worse daily. Currently US equity indices are trading at all time highs, far above levels seen in 2019, a time when the bull market was roaring and there were no macro headwinds. The market has dropped and rallied but the real leg-down is likely yet to come.
Using trillions of dollars the Fed is able to backstop this event and the economy is back on track by Q1-Q2 2021. Stocks rip to new highs like we’ve never seen before. Somehow we manage to dodge inflation and a virus resurgence.
The Fed utilizes QE infinity sending it’s balance sheet soaring to $10T+ but its not enough. Economic activity slows, unemployment spikes, GDP recedes, and the high of cheap debt US companies have been experiencing for the last decade wears off. Earnings multiples begin to recede to fairer levels and stocks crumble.
Yet the sky will not fall tomorrow, door #2 will happen but not before we experience door #1 without the happy ending. The Fed has already been very open in promising they will continue to print their way out of this mess and some form of fiscal stimulus is all but guaranteed at this point. Additionally, Janet Yellen has been given the nod to lead the Treasury during the next administration, further solidifying the position that high inflation rates will be tolerated.
Inflationary pressure on the Dollar will be extreme over the next 1-2 years and we’re already beginning to see it:

The pinnacle of this will likely end in debasement and then possibly a return some kind of standard (gold or crypto). Globally, USD’s place as a reserve currency will be challenged.
So what’s the play?
Avoid cash (USD or equivalents)
Own hard assets (Bitcoin, gold, silver, real estate etc.)
Get long US equities*
Debt*
I like crypto, this is a crypto newsletter, you can scroll to the bottom and see I’m very long Bitcoin. It’s inflation resistant and technologically superior to gold. It will perform well in an inflationary environment. I’m all-in on #2. The interesting ones are #3 and #4.
The Fed’s actions will inevitably continue the melt-up we’ve been seeing since March, stocks are likely going to heights never seen before, but it’s a dangerous game. Gains will be large in nominal terms but in real terms (post inflation) they are likely to under perform hard assets. By longing US equities you’re also putting yourself in a position to trade out of a top, which can be quite difficult.
USD denominated debt at a fixed interest rate is also interesting to look at (think auto loans and mortgages), I’ll cover this in Thursday’s newsletter :)
That’s all for today, thanks for reading and I’ll talk to everyone later this week.
Forward.
– M
Situational Awareness
Exxon is slashing workers and cutting costs as a hobbled oil market slowly recovers – Exxon Mobil, the nation's largest oil company, is losing money like never before. For the first time on record, the firm reported a loss three quarters in a row, from January through September. Analysts expect the company to lose money in the last three months of 2020, as well, according to Bloomberg data. (via BI)
Water Futures to Start Trading Amid Growing Fears of Scarcity – Water is joining gold, oil and other commodities traded on Wall Street, highlighting worries that the life-sustaining natural resource may become scarce across more of the world. (via Bloomberg)
Grayscale Sees a New Group of Ethereum-First Investors – “Over the course of 2020 we are seeing a new group of investors who are Ethereum-first and in some cases Ethereum-only,” Sonnenshein said in an interview with Bloomberg. “There’s a growing conviction around Ethereum as an asset class.” (via CoinDesk)
The Portfolio Rundown
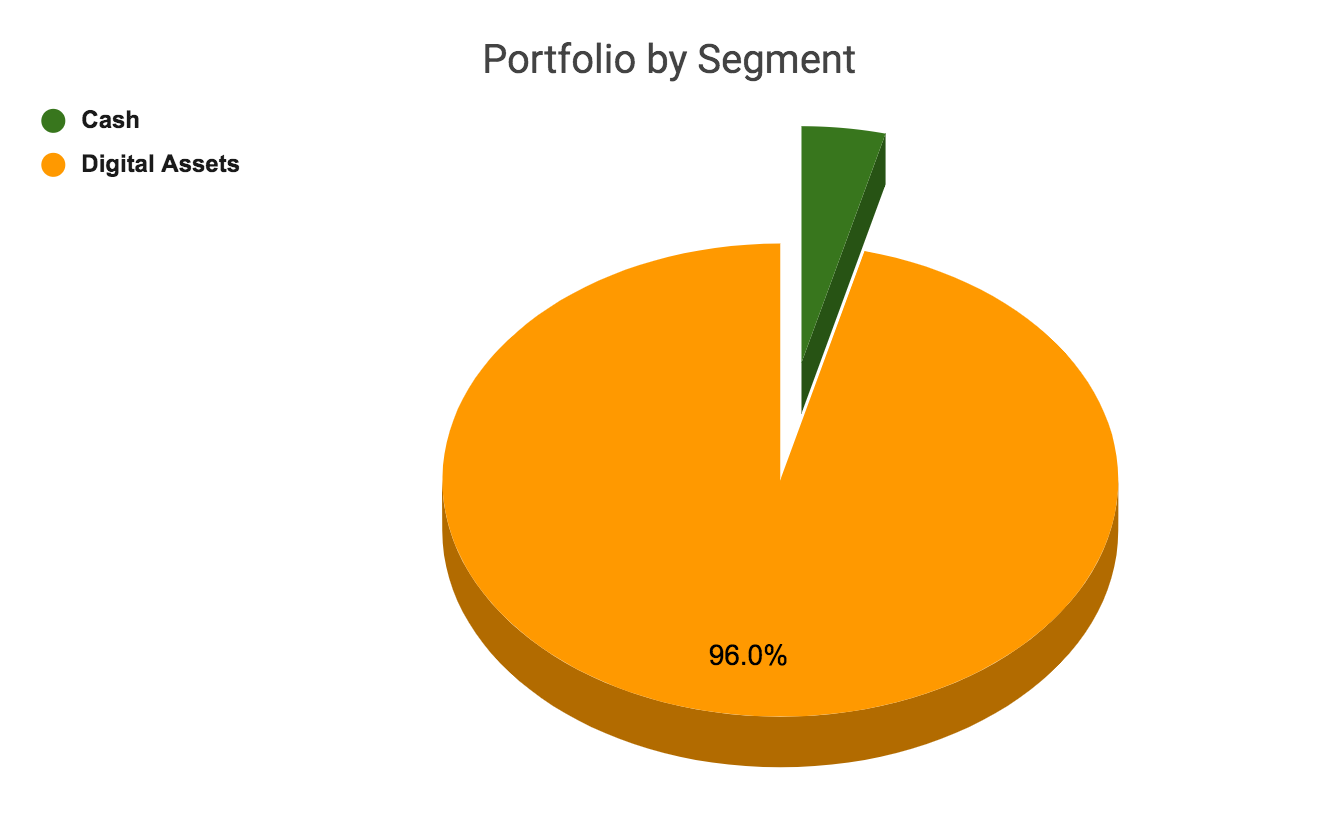


Little movement this week. Bitcoin is trading sideways in the $18k-19k region, a few moves downward were quickly filled so long demand is there but pressure on the short side is intense. This is coming from CME futures, recent volume has spiked, it appears not all institutions are longing BTC. We’ll either see a significant leg down to close out the shorts or a move upward and a race to cover, unclear which is coming. Near term support is at $16k then $13k, upside is likely low $20s.
BTC dominance is currently sitting at ~62% which means the door is open for altcoins, at the peak of the ‘17/’18 mania BTC dominance fell to 34% as altcoin prices ballooned. Capital may bypass Bitcoin and flow to other alts from traders looking for volatility. Very bullish on ETH, LINK, and ADA. Recently it feel like the window to accumulate “cheap” alts is closing.
Nothing in this email is intended to serve as financial advice. Do your own research.
Want to support the community?
BTC: 12aWeXkMtkNPnvjMC5Sfo18ZLFv2eXijJi
ETH: 0x0FF4774695278Ac247AaA8639C22823c0B6f98F5